
From collection COA GIS Collection (Geographic Information Systems)


Page 1
Page 2
Page 3
Page 4
Page 5
Page 6
Page 7
Page 8
Page 9
Page 10
Page 11
Page 12
Page 13
Page 14
Page 15
Page 16
Page 17
Page 18
Page 19
Search
results in pages
Sea Level Rise Modeling using GIS: MDI
Sea Level Rise
Modeling using
GIS: MDI
Photo taken at Hadley point, October 9, 2014, during a king tide.
By
Anyuri M. Betegon A.
Independent Study
Gordon Longsworth
TABLE OF CONTENTS
INTRODUCTION
2
DISCLAIMER AND METHODOLOGY
3
INDEX MAP
4
SEA-LEVEL RISE AND TAX PARCEL OVERLEY
5
COMPARISON TO FEMA SEA-LEVEL RISE MODEL
11
CLAMFLAT AND SEA LEVEL RISE
12
KING TIDES AND SEA-LEVEL RISE IN MDI
13
WILDLIFE AND SEA-LEVEL RISE IN MDI
15
THE BIG PICTURE
16
ADAPTATION STRATEGIES
17
CONCLUSION
17
RESOURCES
18
1
INTRODUCTION
This project is intended to project impacts of climate change specifically sea level rise on Mount
Desert Island (MDI) in order to determining possible strategies for adaptation for MDI. Even small
slight changes in sea level rise can produce rare floods increasing the impact of tides and storm surges.
To account for storm surges requires to use SLOSH (Sea, Lake and Overland Surge from Hurricanes)
modelling for this particular project we will not map SLOSH. This project an opportunity to look at
losses and damages (the economic, physical, and human losses and damages caused by the effect of
climate change).
Climate change occurs when weather patterns are altered irreversibly. It is considered a
global social, political, and environmental issue. The United Nations Framework Convention
on Climate Change defines climate change as "a change of climate which is attributed directly or
indirectly to human activity that alters the composition of the global atmosphere and which is in
addition to natural climate variability observed over comparable time periods."
The primary contributions to changes in the volume of water in the ocean are the expansion
of the ocean water as it warms and the transfer to the ocean of water currently stored on land (ice
sheets). The highest observed flood at the Hancock County in our records from 1958 to 2013,
reached 4.95 ft. in 1997 (Climate Central, 2014).
In many places climate change related impacts have reached a level beyond just using
adaptation strategies to counteract them but rather they are at a level of having to deal with significant
losses and damages that are deeply detrimental to livelihoods and life in these places. Loss and damage
tackle changes and destructions arising from climate change. It includes economic and non-economic
losses and damages. The impacts are classified into two: slow onset (sea-level rise, ocean acidification,
etc.) and extreme events (hurricanes, droughts, floods, heat waves, etc.). The time factor does not make
less slow onset processes.
2
GOALS
To learn how to model sea level rise in GIS
To have a better understanding of the economic and biophysical impacts that climate change
can have on MDI
To comprehend better what could be done to avoid irreparable loses and damages
QUESTIONS
What is an effective and accessible way for island communities to model climate change
impacts and possible adaptation strategies?
To what extent can possible examples of such modeling be built out of studying MDI? Is it
worth it?
To what extent will MDI will be affected through looking at the visible vulnerable areas?
How does it stand beside other models?
What can be proposed for MDI to adapt?
Disclaimer about maps
The maps in this report illustrate the scale of potential sea level rise from 1 to 5 ft rise, from
mean high tide. The following places were selected because showed some degree of impact by the
rise of sea level all the way to five feet. This study does not account subsidence, future constructions,
storm surges or wind speed. Areas shown in the maps are susceptible to storm surge and wind speed,
therefore possible impacts may be more dramatic as predicted by this model.
Methodology
GIS data used: MDI lidar (Digital Elevation model), MDI shore line, MDI parcels, MDI
coastal marine geology and Aerial imagery.
The digital elevation model was used to identify 1, 2, 3, 4, and 5 ft sea-level rise. Areas of
study were overlaid with tax parcel to see economic impacts. On a different map mudflats were
overlaid to understand the location of mudflats for the economic commentary. Secondary and
Primary literature were used: Intergovernmental Panel for Climate Change (IPCC), United Nation
Convention on Climate Change (UNFCCC), The Rocky Mountain Climate Organization, among
others.
3
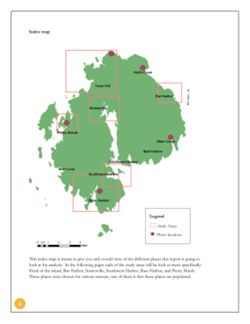
Index map
Hulls Cove
Town Hill
N
Bar Harbor
Somesville
Pretty Marsh
Otter Creek
Seal Harbor
Northeast Harbor
Seal Cove
Southwest Harbor
Bass Harbor
Legend
Study Areas
Photo locations
0051
2
3
4
Miles
This index map is meant to give you and overall view of the different places this report is going to
look at for analysis. In the following pages each of the study areas will be look at more specifically:
Head of the island, Bar Harbor, Somesville, Southwest Harbor, Bass Harbor, and Pretty Marsh.
These places were chosen for various reasons, one of them is that these places are populated.
4
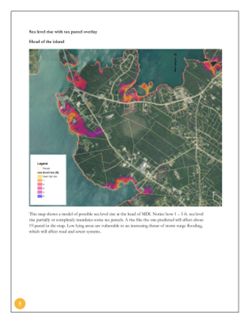
Sea level rise with tax parcel overlay
Head of the island
N
Legend
Parcels
sea level rise (ft)
Mean high tide
1
2
3
4
5
This map shows a model of possible sea level rise at the head of MDI. Notice how 1 - 5 ft. sea level
rise partially or completely inundates some tax parcels. A rise like the one predicted will affect about
19 parcel in the map. Low lying areas are vulnerable to an increasing threat of storm surge flooding,
which will affect road and sewer systems.
5
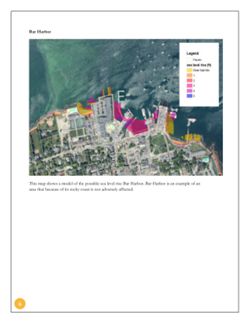
Bar Harbor
Legend
Parcels
sea level rise (ft)
Mean high tide
1
2
3
4
5
This map shows a model of the possible sea level rise Bar Harbor. Bar Harbor is an example of an
area that because of its rocky coast is not adversely affected.
6
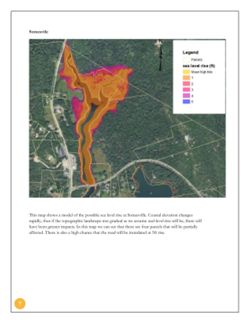
Somesvile
N
Legend
Parcels
sea level rise (ft)
Mean high tide
1
2
3
4
5
This map shows a model of the possible sea level rise at Somesville. Coastal elevation changes
rapidly, thus if the topographic landscape was gradual as we assume seal-level rise will be, there will
have been greater impacts. In this map we can see that there are four parcels that will be partially
affected. There is also a high chance that the road will be inundated at 5ft rise.
7
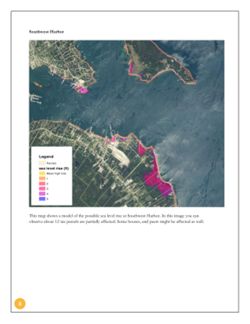
Southwest Harbor
Legend
Parcels
sea level rise (ft)
Mean high tide
1
2
3
4
5
This map shows a model of the possible sea level rise at Southwest Harbor. In this image you can
observe about 12 tax parcels are partially affected. Some houses, and peers might be affected as well.
8
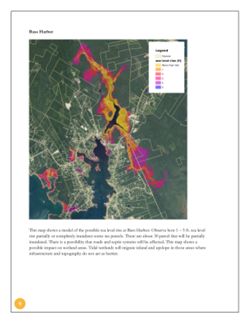
Bass Harbor
Legend
Parcels
sea level rise (ft)
Mean high tide
1
2
3
4
5
This map shows a model of the possible sea level rise at Bass Harbor. Observe how 1 - 5 ft. sea level
rise partially or completely inundates some tax parcels. There are about 30 parcel that will be partially
inundated. There is a possibility that roads and septic systems will be affected. This map shows a
possible impact on wetland areas. Tidal wetlands will migrate inland and upslope in those areas where
infrastructure and topography do not act as barrier.
9
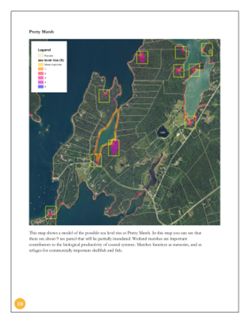
Pretty Marsh
Legend
Parcels
sea level rise (ft)
Mean high tide
1
2
3
4
5
This map shows a model of the possible sea level rise at Pretty Marsh. In this map you can see that
there are about 9 tax parcel that will be partially inundated. Wetland marshes are important
contributors to the biological productivity of coastal systems. Marshes function as nurseries, and as
refuges for commercially important shellfish and fish.
10
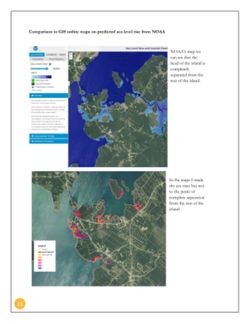
Comparison to GIS online maps on predicted sea level rise from NOAA
Sea Level Rise and Coastal Flood
NOAA's map we
Sea Level Rise
Confidence
Marsh
+
Vulnerability
Flood Frequency
Mount Desert Narrows
can see that the
Sea Level Rise
?
head of the island is
5ft SLR
completely
Legend
Water Depth
separated from the
Low-lying Areas
Thomas
Island
rest of the island.
Area Not Mapped
1
Visualization Location
View Levees
Thomas
Overview
Bay
Use the slider bar above to see how various levels
of sea level rise will impact this area.
Levels represent inundation at high tide. Areas that
are hydrologically connected are shown in shades
of blue (darker blue greater depth).
Low-lying areas, displayed in green, are
hydrologically "unconnected" areas that may flood.
They are determined solely by how well the
elevation data captures the area's hydraulics A
more detailed analysis of these areas is required to
determine the susceptibility to flooding.
Understanding The Map
Additional Information
In the maps I made
the sea rises but not
to the point of
complete separation
from the rest of the
island
Legend
Parcels
sea
level rise (ft)
LE
Mean high tide
1
2
3
4
5
11
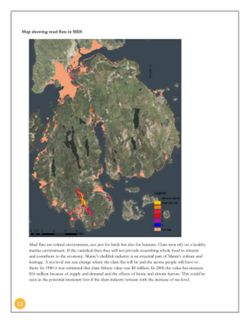
Map showing mud flats in MDI
Legend
Sea ev XII
Mean non tide
1
La
4
5
0 0,5 1
2
3
4
Mud tas
E
Mud flats are critical environment, not just for birds but also for humans. Clam men rely on a healthy
marine environment. If the vanished then they will not provide nourishing whole food to citizens
and contribute to the economy. Maine's shellfish industry is an essential part of Maine's culture and
heritage. A sea level rise can change where the clam flat will be and the access people will have to
them. In 1980 it was estimated that clam fishery value was $8 million. In 2006 the value has increase
$16 million because of supply and demand and the effects of biotic and abiotic factors. This could be
seen as the potential monetary lost if the clam industry retreats with the increase of sea level.
12
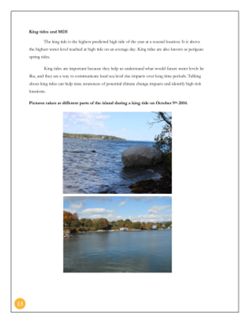
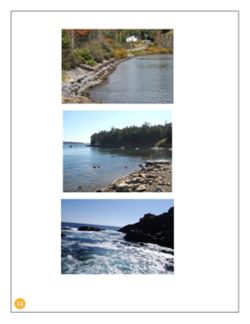
King tides and MDI
The king tide is the highest predicted high tide of the year at a coastal location. It is above
the highest water level reached at high tide on an average day. King tides are also known as perigean
spring tides.
King tides are important because they help us understand what would future water levels be
like, and they are a way to communicate local sea level rise impacts over long time periods. Talking
about king tides can help raise awareness of potential climate change impacts and identify high risk
locations.
Pictures taken at different parts of the island during a king tide on October 9th, 2014.
13
14
Wildlife and sea level rise in MDI
"Birds that require the marsh for rearing young (e.g., Black and Clapper Rails, some terns
and plovers) will be affected negatively by its loss, whereas birds that feed in shallow water or
on intertidal sand and mud flats that replace the marsh (e.g., dabbling ducks, some shorebirds)
will be affected positively."
The Intergovernmental Panel on Climate Change predicted that sea level will rise two feet in
the next century. Areas in Acadia that have low elevation, such as the Otter Cliffs causeway, are often
flooded by a combination of astronomical high tide and severe storms. As the sea rises these coastal
habitats will slowly flood and become uninhabitable to the plants and animals that depend on it. This
causes a shift in biodiversity within the park as some coastal species are forced to adapt to the
changing environment. Wetland plant systems might not be able to move inland as sea level rises on
sedimentary shores because seaside development by humans limits that option.
Many plant and animal species in Acadia can only exist in particular temperature ranges and
climatic regions. Certain areas on the coast of MDI are habitat for rare, threatened, or endangered
species of plants and animals, if this areas are negatively impacted, there will be serious losses. And
the loss of "potentially significant genetic information."
"Nesting birds in Acadia that could be adversely affected by a changed climate are loons, bald
eagles, peregrine falcons, and seabirds that nest on low-lying islands."
Sea level rise can affect Acadia's salt marshes and freshwater. These habitat support a great
diversity of plant and animal life. Where there is no suitable space for salt marshes to migrate inland
with the rising sea, entire ecosystems may be lost.
15
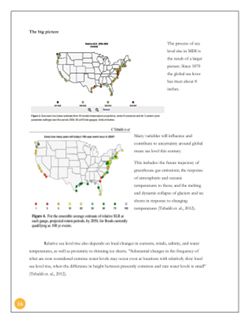
The big picture
Relative SLR, 2008-2050
The process of sea
(meters)
level rise in MDI is
the result of a larger
picture. Since 1870
the global sea lever
has risen about 8
inches.
o
0.1-0.2
0.2-0.3
0.3-0.4
0.4-0.5
+
Reset
Figure 2. Sea level rise (mean estimate from 19 models temperature projections, under 6 scenarios and for 3 carbon cycle
parameter settings) over the period 2008-50 at 55 tide gauges. Units of metres.
C Tebaldi et al
Every how many years will today's 100-year event recur in 2050?
Many variables will influence and
contribute to uncertainty around global
mean sea level this century.
This includes: the future trajectory of
greenhouse gas emissions; the response
of atmospheric and oceanic
temperatures to these; and the melting
and dynamic collapse of glaciers and ice
sheets in response to changing
1
2
5
10
20
30
50
75
100
temperatures (Tebaldi et. al., 2012).
Figure 4. For the ensemble average estimate of relative SLR at
each gauge, projected return periods, by 2050, for floods currently
qualifying as 100 yr events.
Relative sea level rise also depends on local changes in currents, winds, salinity, and water
temperatures, as well as proximity to thinning ice sheets. "Substantial changes in the frequency of
what are now considered extreme water levels may occur even at locations with relatively slow local
sea level rise, when the difference in height between presently common and rare water levels is small"
(Tebaldi et. al., 2012).
16
Adaptation strategies
This study suggest the following adaptation strategies:
Areas at low elevation (the road network, utilities, and septic systems) will require periodic
evaluation and upgrade to avoid losses.
Measures to ensure the continued survival of wetland ecosystems as sea level rises need to be
thoroughly assessed.
Low impact development approaches that minimize new impervious surface area and
maximize on-site infiltration of runoff will help to maintain the health of the coast of MDI.
Increase protection of freshwater wetlands throughout watershed.
Greater flexibility is needed in siting and in farming structures, and it is also important to
take appropriate decisions to prevent land runoff and contamination of near shore
environments.
Conclusion
As the earth's climate becomes warmer, sea level will slowly rise due to melting glaciers.
This rise combined with an increase in storms and hurricane frequency and intensity would create
more severe storm surges, surges that not only may damage ecosystems and coastal infrastructures
but adversely impact plant and animal species. Sea-level rise will pose significant challenges to Mount
Desert Island management strategies. Plans for maintenance and restoration of coastal areas will
support wildlife and reduce flood's impacts. The identification of upslope migration of wetlands is
key to restricting further development that could reduce the resilience of the ecosystems. As shown
in the maps of this study the location of high risk areas vary because of the heterogeneity of the
topography. A SLOSH model that includes sea-level rise used in this study will show a less
conservative scenario. This scenario needs to be included in order to take better decision in relation
to adaptation strategies.
Acknowledgements
Thanks to Gordon Longsworth, and Acadia National park for their insights on how to go
about this project.
17
RESOURCES
Climate Central. (2014). Sea Level Rise and Coastal Flood Exposure: Summary for
Hancock County, ME.
Ecosystem Indicator Partnership. Information on Change in the Gulf of Maine. 2010.
Available at: http://www.gulfofmaine.org/esip/ESIPFactSheetAquacultureversion3pdf
IPCC Report of the Science of Climate Change. 2013. Available at:
http://www.climatechange2013.org/
Manomet Center. 2013. Manomet Center Report: A Summary of Vulnerability of Habitats
and Priority Species.
National Park Service. Geology Fieldnotes. Sand beach formation information. Available at:
http://www.nature.nps.gov/geology/parks/acad/
New England Environmental Finance Center developed the Coastal Adaptation
Climate Change Resilience Pilot Project. Available at:
http://www.fhwa.dot.gov/environment/climate change/adaptation/ongoing and current
research/vulnerability assessment_pilots/index.cfm
Saunders, S., Easley, T., and Spencer, T. 2010. Acadia Perils: 1, 2, 3 and 4.
Surging Seas Risk Finder. 2014. Available at: http://sealevel.climatecentral.org/
Tebaldi, C., Strauss, B., and Zervas, C. 2012. Modelling sea level rise impacts on storm
surges along US coasts.
The University of Maine. 2009. Maine Climate Future: An initial Assessment.
Titus, J. Sea Level Rise and Wetland Loss: An Overview. Office of Policy Analysis U.S.
Environmental Protection Agency Washington, D.C. 20460
18
Viewer Controls
Toggle Page Navigator
P
Toggle Hotspots
H
Toggle Readerview
V
Toggle Search Bar
S
Toggle Viewer Info
I
Toggle Metadata
M
Zoom-In
+
Zoom-Out
-
Re-Center Document
Previous Page
←
Next Page
→
Sea Level Rise Modeling using GIS: MDI
Report on projected sea level rise in various parts of Mount Desert Island, Maine, containing high-quality GIS maps.

